1.0 Prometheus - Overview
Prometheus is an open-source system monitoring and alerting toolkit that is originally built at SoundCloud.
The Prometheus project comprehends multiple interlocking components entailing:
Prometheus Server: This serves as the system’s brain by gathering various
metrics and store them in a time-series database. Prometheus majorly scrapes metrics from applications and services (like Docker containers)
at designated intervals utilizing the Prometheus client libraries whereas other systems monitoring tools wait to receive information.
Prometheus Client Libraries: These libraries help users integrate their services by sending metrics and data in a format that can be understood by Prometheus.
Prometheus Alertmanager: This sends alerts and notifications to designated users when the tool senses anomalies, glitches, and performance issues.
Prometheus Visualisation Tools: It is used to display metrics and data in a human-readable format. Apart from this, various Prometheus users integrate the tool with Grafana which is an open-source web application for analytics and data visualization.
Main features are:
• It has no reliance on distributed storage; single server nodes are autonomous
• Time series collection happens via a pull model over HTTP
• Pushing time series is supported via an intermediary gateway
• Targets are discovered via service discovery or static configuration
• Availability of multiple modes of graphing and dashboarding support
You can find more details at https://prometheus.io/docs/introduction/overview/
1.1 Prerequisites
The minimal requirements for deploy prometheus are as follows:
At least 2 CPU cores
At least 4 GB of Memory
At least 20 GB of free disk
You should not have problem to deploy in Azure, but we recommed select the below sizes:
- Standard D-Series v4 & v5: D2as_v4, D4as_v4, D2as_v5 and D4as_v5
Be sure to use large Virtual Machines and add extra disk as needed.
2.0 Deploying Prometheus
Now let's begin with the fun part!
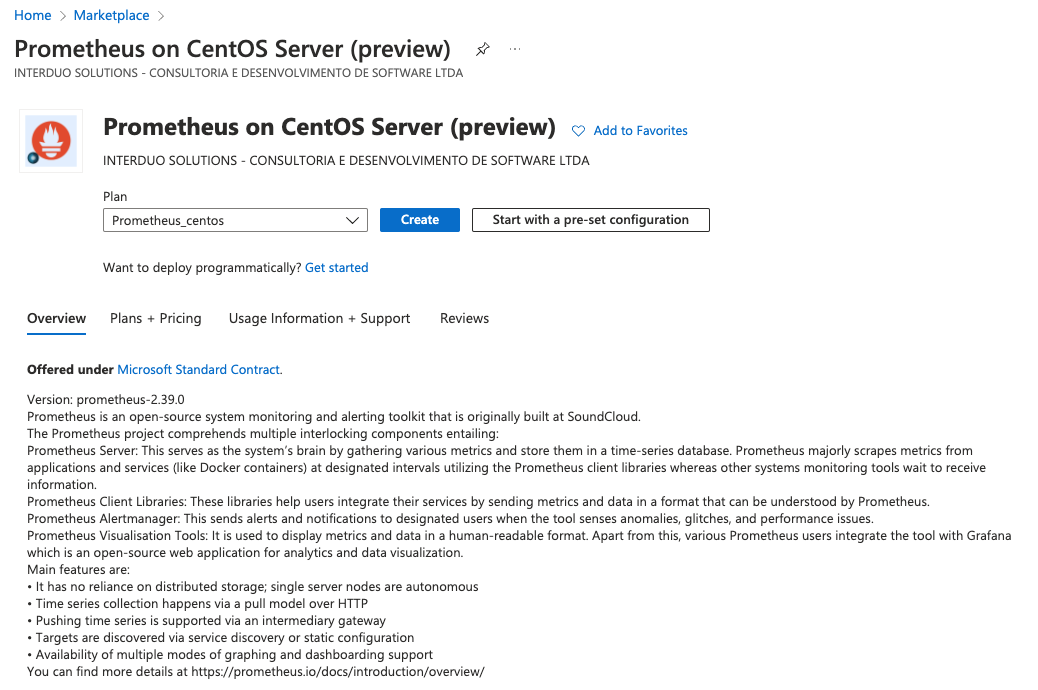
The first step is create the new Virtual Machine using our Marketplace solution, for that just login in the Azure portal and search for "Prometheus on CentOS Server"

Check the plan and click in "CREATE"

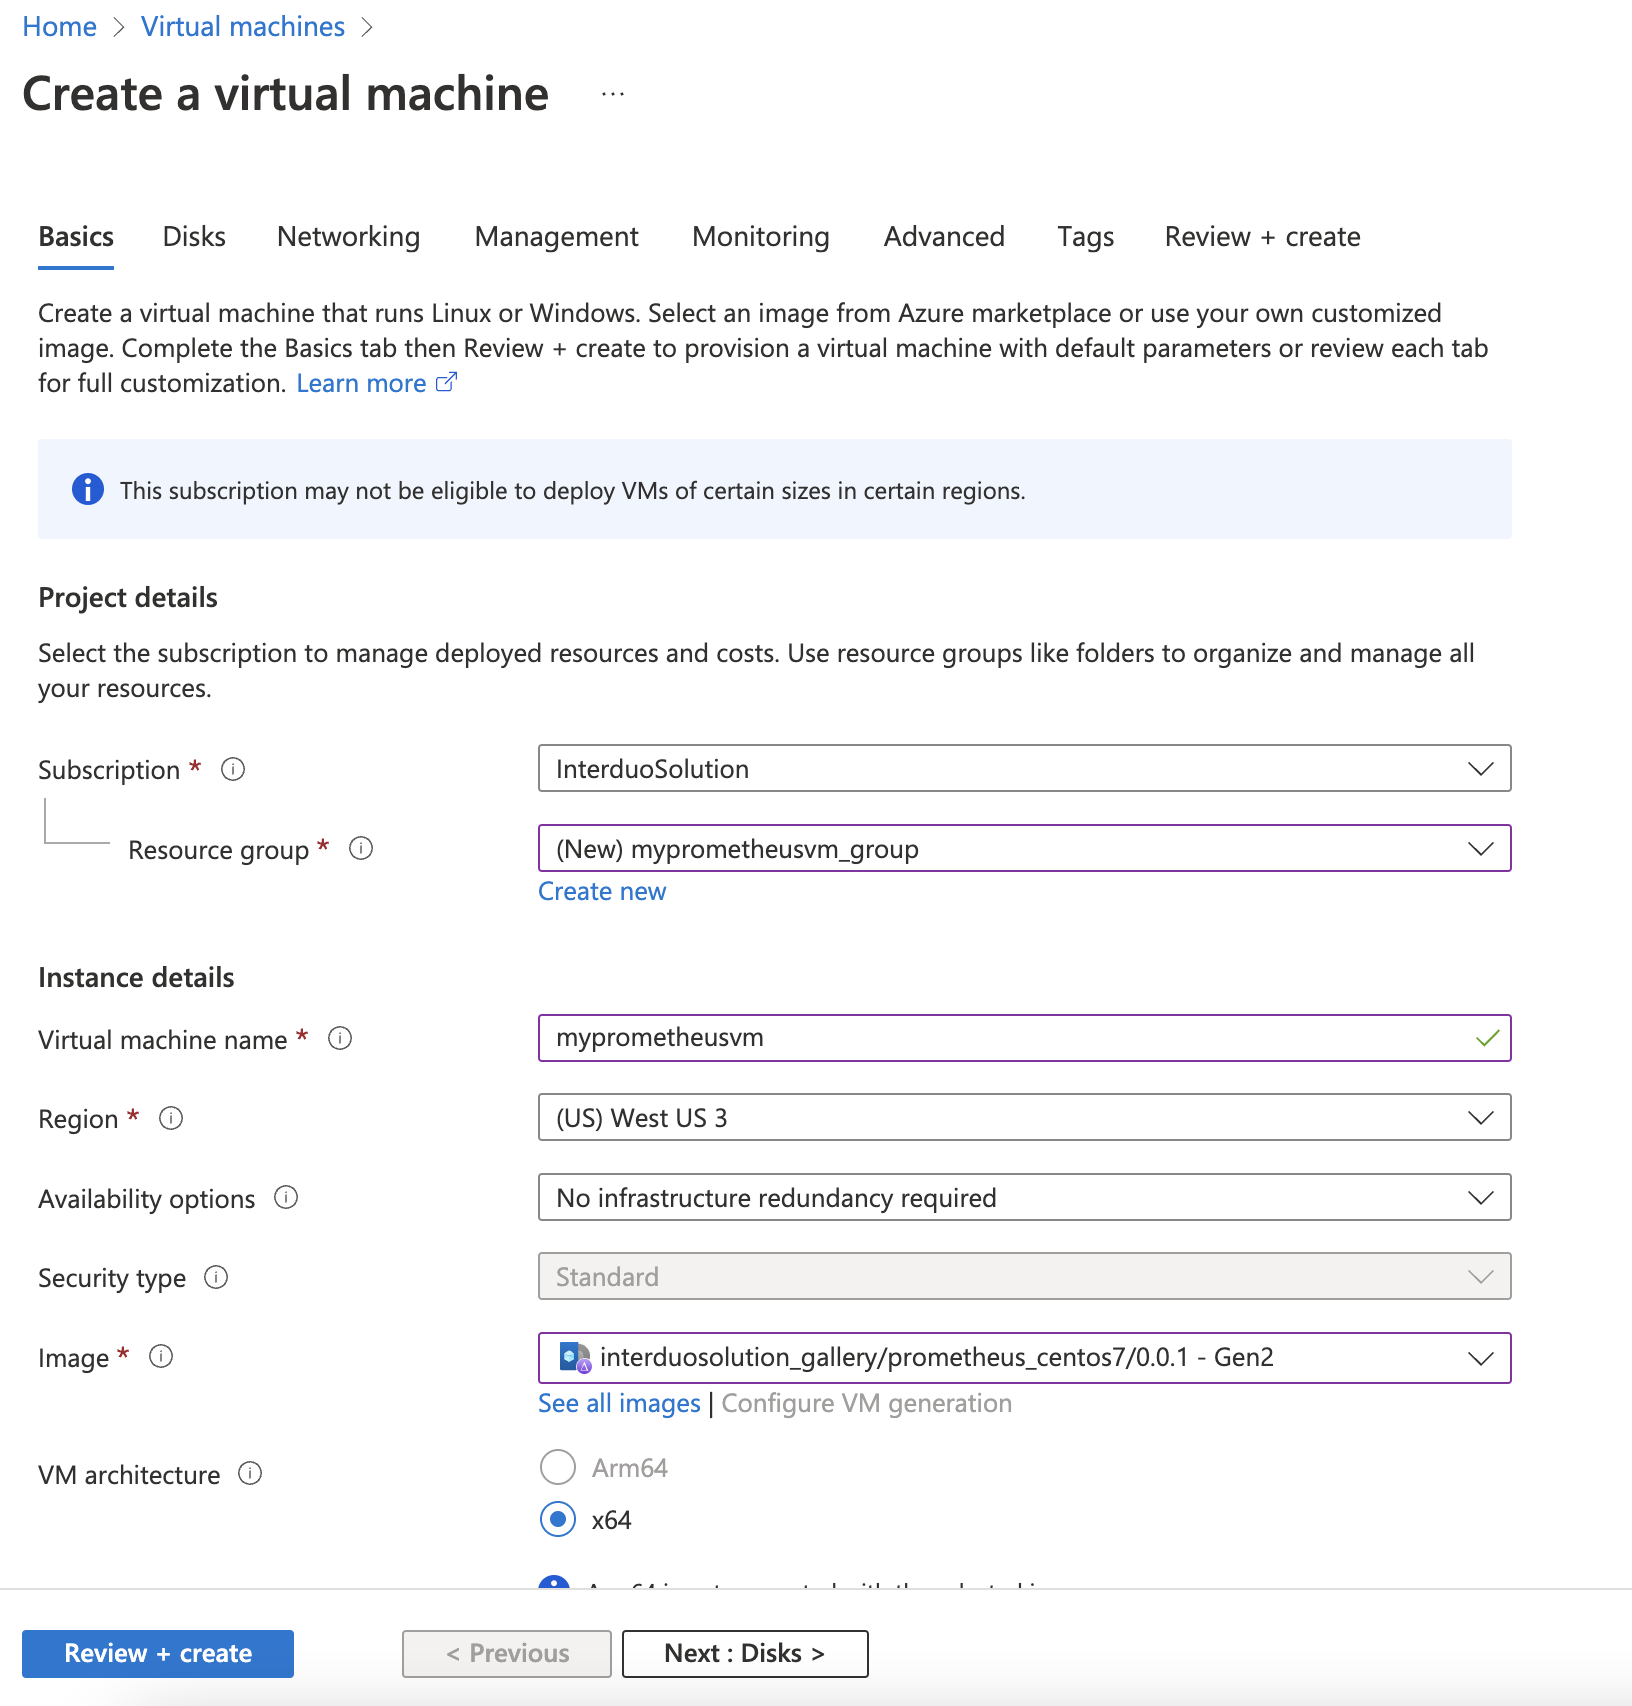
Select the name of you Virtual Machine, size, networking, disk, etc.

Important: We recommed to add extra disk to store your data, please check Configuring disk extension for more details.
Check if everthing is fine, review and create the Virtual machine, the creation will take a couple minutes.
That is all! You now can connect by ssh or console.
To connect using the console, just access http://yourvmIP:9090
In my case, my Public IP was 20.171.42.106

You can also connect using the ssh command line. For more information, see How to use SSH with Linux on Azure.
$ssh username@yourvmIP
For more information in how to monitor Linux VM, please access Node exporter guide.
2.1 Configuring disk extension
We recommend add extra disk to store your data, you can add the extra disk during or after the creation of the solution.
As you can see in the image below, we added an additional disk with 20GB for our data. You can check the link for more information in how to attach a data disk to a Linux VM

To partition, format, and mount your new disk, SSH into your VM.
Once connected to your VM, you need to find the disk. In this example, we are using$ssh username@yourvmIP
fdisk to list the disks.
# fdisk -l | grep Disk
WARNING: fdisk GPT support is currently new, and therefore in an experimental phase. Use at your own discretion.
Disk /dev/sda: 32.2 GB, 32212254720 bytes, 62914560 sectors
Disk label type: gpt
Disk identifier: BDE4368E-CB4D-4467-BEF9-E2665AF59129
Disk /dev/sdb: 80.5 GB, 80530636800 bytes, 157286400 sectors
Disk label type: dos
Disk identifier: 0x1e56eb14
Disk /dev/sdc: 21.5 GB, 21474836480 bytes, 41943040 sectors
We can see the Disk /dev/sdc that we attached in the Virtual Machine.
Format the diskThe following example uses parted on /dev/sdc, which is where the first data disk will typically be on most VMs. Replace sdc with the correct option for your disk. We are also formatting it using the XFS filesystem.
sudo parted /dev/sdc --script mklabel gpt mkpart xfspart xfs 0% 100%
sudo mkfs.xfs /dev/sdc1
sudo partprobe /dev/sdc1
Now let's check our new partion and copy the UUID as we'll need this value in the nexts steps:
# sudo blkid
/dev/sda2: UUID="8fad5ef4-9341-44dc-9538-1941f55e4f44" TYPE="xfs" PARTUUID="fd2b2dda-b5cf-4490-a3c5-a1127e1dfd32"
/dev/sdb1: UUID="86b913a0-7220-4749-b436-d439e007c589" TYPE="ext4"
/dev/sda1: UUID="ae9ae61c-c596-4593-8a33-8deeb9820e38" TYPE="xfs" PARTUUID="5c86595d-a28a-43ea-9102-f192eee01417"
/dev/sda14: PARTUUID="593a0311-9927-4e3f-9778-a4953ae15f76"
/dev/sda15: SEC_TYPE="msdos" UUID="38D3-7C4E" TYPE="vfat" PARTLABEL="EFI System Partition" PARTUUID="60f61173-b112-4c24-9d65-c7035541eb15"
/dev/sdc1: UUID="7b49425e-4280-41ba-938f-a74daf035ba4" TYPE="xfs" PARTLABEL="xfspart" PARTUUID="2abc4e40-2376-43ee-ae41-9a5667a85380"
Creating the new partition
Unfortunately we can't extend the local FS, so we need to create a new partition and a new File system. to be able to do that we need first bring down the prometheus proscess with the
systemctl command
# sudo systemctl stop prometheus.service
Let's do a backup of the data:
# sudo cp -r /var/lib/prometheus/ /tmp
Use mount to then mount the filesystem. The following example mounts the /dev/sdc1 partition to the /var/lib/prometheus/ mount point:
sudo mount /dev/sdc1 /var/lib/prometheus/
Now, let's restore the data that we copy to the /tpm directory and configure the permission for the prometheus user then we can start the service
# sudo cp -r /tmp/prometheus/* /var/lib/prometheus/Persist the mount.
# sudo chown prometheus:prometheus -R /var/lib/prometheus/
# sudo systemctl start prometheus.service
Last but not least, we need to configure the fstab file to persist the mount. to do that we need the UUID that we got with the command blkid in this example the UUID is 7b49425e-4280-41ba-938f-a74daf035ba4
Open the file /etc/fstab and add the line UUID=7b49425e-4280-41ba-938f-a74daf035ba4 /var/lib/prometheus/ xfs defaults,nofail 1 2
sudo vim /etc/fstab
Bellow an example of my file after the changes:
# sudo cat /etc/fstab
#
# /etc/fstab
# Created by anaconda on Mon Feb 7 21:47:58 2022
# # Accessible filesystems, by reference, are maintained under '/dev/disk'
# See man pages fstab(5), findfs(8), mount(8) and/or blkid(8) for more info
#
UUID=8fad5ef4-9341-44dc-9538-1941f55e4f44 / xfs defaults 0 0
UUID=ae9ae61c-c596-4593-8a33-8deeb9820e38 /boot xfs defaults 0 0
UUID=38D3-7C4E /boot/efi vfat defaults,uid=0,gid=0,umask=0077,shortname=winnt 0 0
/dev/disk/cloud/azure_resource-part1 /mnt/resource auto defaults,nofail,x-systemd.requires=cloud-init.service,comment=cloudconfig 0 2
UUID=7b49425e-4280-41ba-938f-a74daf035ba4 /var/lib/prometheus/ xfs defaults,nofail 1 2
You can check all Filesystems using the command df -h.
# df -h
Filesystem Size Used Avail Use% Mounted on
devtmpfs 3.9G 0 3.9G 0% /dev
tmpfs 3.9G 0 3.9G 0% /dev/shm
tmpfs 3.9G 8.5M 3.9G 1% /run
tmpfs 3.9G 0 3.9G 0% /sys/fs/cgroup
/dev/sda2 30G 1.8G 28G 6% /
/dev/sda1 494M 75M 420M 16% /boot
/dev/sda15 495M 12M 484M 3% /boot/efi
/dev/sdb1 74G 53M 70G 1% /mnt/resource
tmpfs 783M 0 783M 0% /run/user/1000
tmpfs 783M 0 783M 0% /run/user/0
/dev/sdc1 20G 35M 20G 1% /var/lib/prometheus
2.2 Securing prometheus
You can find more information about Prometheus security at https://prometheus.io/docs/operating/security/